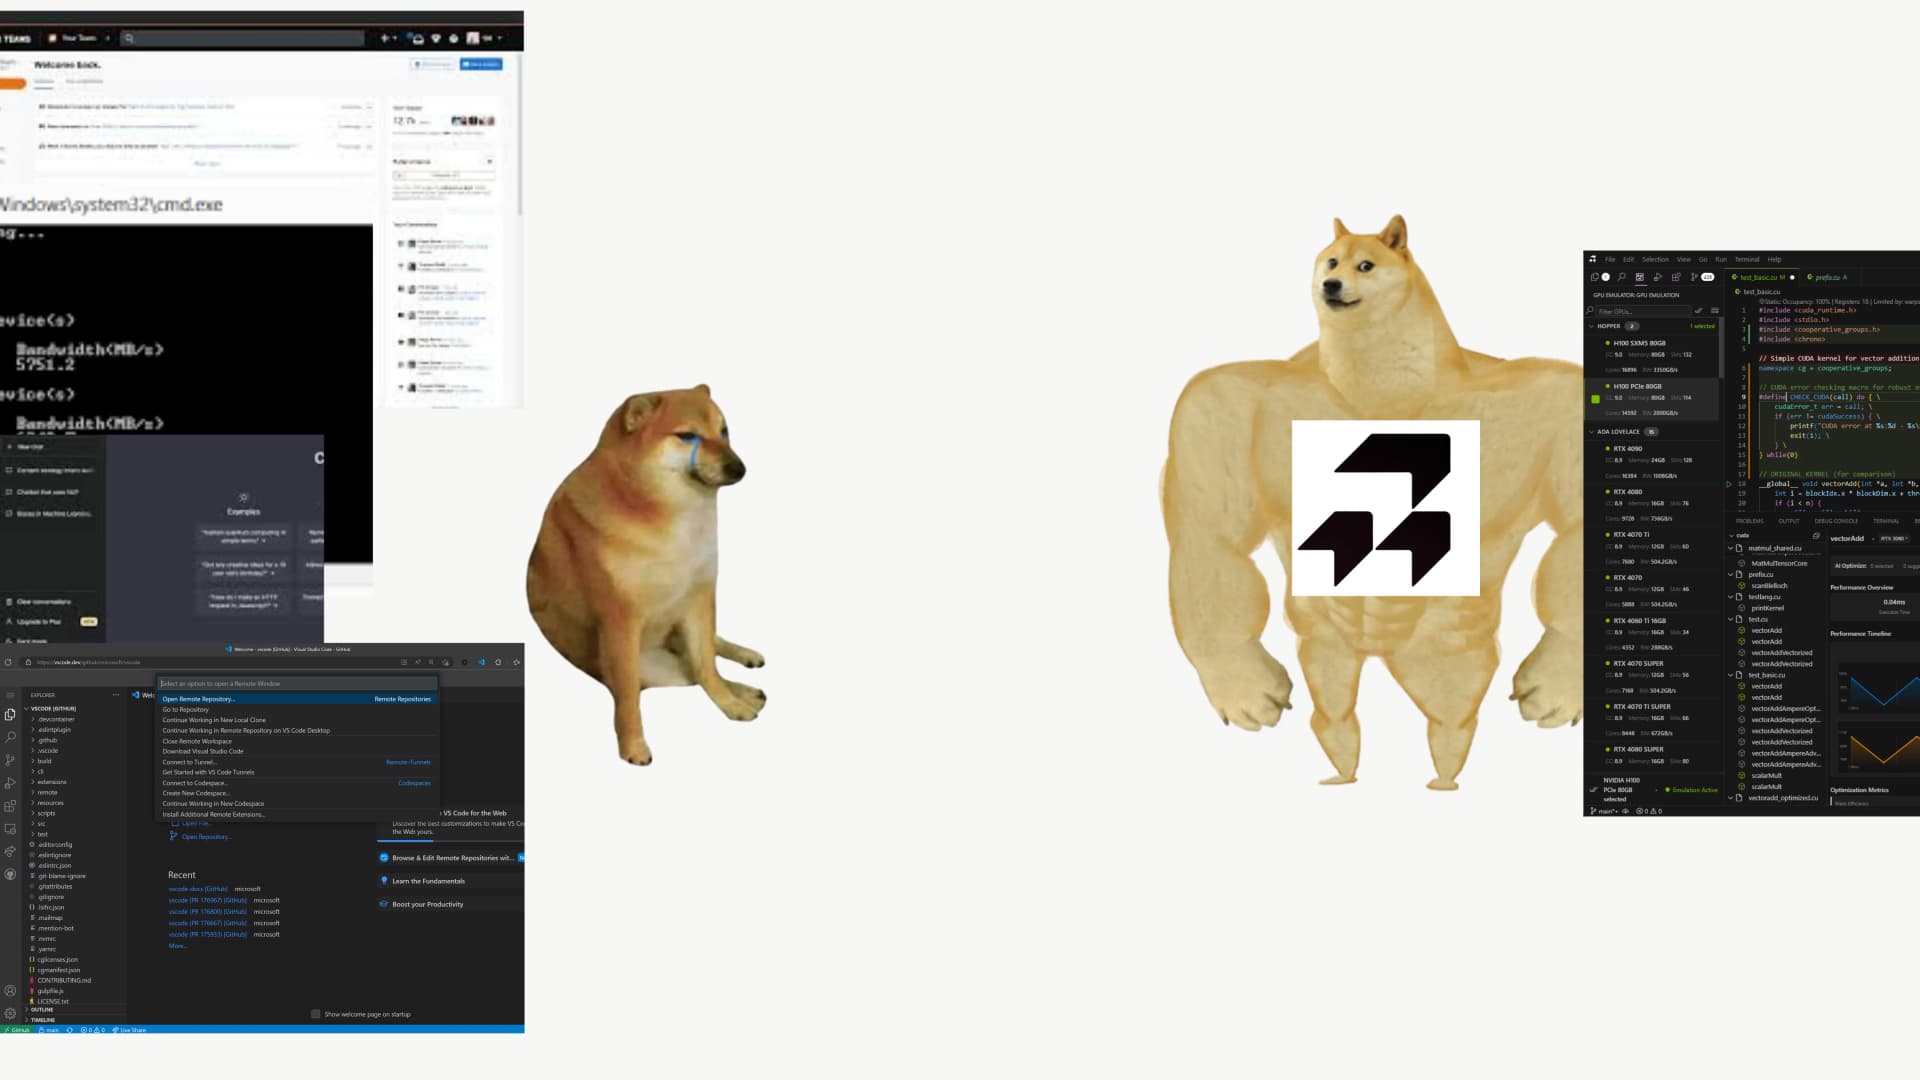
You're switching between four different applications to profile a single kernel. Nsight Compute for metrics. Visual Studio for the code. A terminal for compilation. nvidia-smi in another window. By the time you find the memory bottleneck, you've forgotten what you were optimizing.
This isn't a skill issue. It's a tooling issue.
The typical CUDA workflow (15-30 min per iteration):

  Write code      →    Compile    →    Profile     →   Google metrics
  (VS Code)            (terminal)      (Nsight)         (browser)
      ↑                                                      │
      │                                                      │
      └──────────────── Switch back, fix, repeat  ───────────┘

Each arrow = switching apps, losing context, copying metrics manually.
Time wasted per kernel: 4-8 hours across 15-20 iterations.Most CUDA developers use 5-7 disconnected tools:
Each tool is excellent at its job. The problem is they don't talk to each other.
You spend more time managing context switches than actually optimizing kernels.
Can you go from "this kernel is slow" to "fixed, 3x faster" without leaving your editor?
Can you test on an A100 without renting one?
Can you get an answer to "why is occupancy at 31%" that isn't just the raw metric?
These aren't luxury features. They're the difference between shipping kernels in days versus weeks.
If you're on Windows and need to debug serious GPU crashes, this is it. Breakpoints work directly in CUDA kernels. GPU registers appear in familiar Visual Studio windows.
The catch: Since 2019, profiling moved to standalone Nsight Compute. Debugging stays in Visual Studio, but performance analysis happens in a separate app. You're back to switching applications.
Best for: Windows developers debugging race conditions and memory corruption.
JetBrains built proper CUDA support through CMake integration. Code navigation and refactoring work. The interface is familiar if you already use IntelliJ or PyCharm.
Debugging works on Linux via cuda-gdb. Profiling is external. You're paying $89/year for a C++ IDE that understands CUDA syntax but doesn't integrate the full workflow.
Best for: Cross-platform teams who value code intelligence.
Minimal resource usage. Excellent remote development over SSH, WSL, Docker. Free and open source.
CUDA debugging works on Linux targets. Profiling happens in external Nsight Compute. The extension adds syntax highlighting but you're still orchestrating multiple tools manually.
Best for: Remote workflows and developers who want minimal overhead.
nvcc, cuda-gdb, Nsight Compute CLI. Scriptable, automatable, perfect for CI/CD pipelines.
You're typing every command manually. Every profiling session requires memorizing flags. No AI interpretation of metrics. This is for people who want complete control and don't mind the friction.
Best for: Build automation and when you need precise control.
We built this to connect all the tools together.
Profiling Terminal with AI Bottleneck Detection
Under the hood, RightNow AI uses NVIDIA Nsight Compute for profiling - we run it automatically and display results in the profiling terminal with AI interpretation. The AI analyzes Nsight metrics and pinpoints bottlenecks: "Your kernel is memory-bound. L2 cache hit rate is 23%. Uncoalesced access on line 47 causing 65% slowdown."
Need deeper analysis? One-click button opens the full NVIDIA Nsight Compute GUI with your current profile already loaded. No manual file selection, no copying kernel names. All your context transfers automatically.
Multi-GPU Profiling
Profile across multiple GPUs simultaneously. See how your kernel performs on different cards, identify GPU-specific bottlenecks, optimize for heterogeneous setups. The profiling terminal shows side-by-side metrics for each GPU.
Benchmarking Terminal
Test every configuration combination automatically. Block sizes (64, 128, 256, 512), tile sizes, shared memory layouts - run comprehensive benchmarks on single GPU or multi-GPU setups. Visual charts show which config wins for your specific hardware.
Remote GPU Connections
Connect to cloud GPUs (RunPod, AWS, Lambda Labs) or on-premise servers via SSH. Setup is automatic - paste SSH details, we handle the rest. Profile remote kernels as if they're running locally. No manual file syncing, no copying profiler outputs.
GPU Emulator
Test kernels on A100, H100, or 50+ other architectures without owning the hardware. 98% accuracy across architectures. No more "works on my 3090, crashes on customer's A100."
AI Agent ("Forge")
Takes Nsight profiler output and writes optimization patches autonomously. You review and apply. It's like having a CUDA expert who's read every Nsight metric.
Free tier: unlimited profiling/benchmarking, limited AI credits, emulator access, remote GPU support
Pro ($20/mo): full AI analysis, unlimited emulation, multi-GPU profiling
Best for: Developers who want integrated profiling, AI bottleneck detection, multi-GPU testing, and remote GPU workflows without expensive cloud rentals.
Making the emulator handle every kernel pattern at >99% accuracy. Expanding beyond CUDA to support Triton. Training Forge to handle more complex optimization chains.
We're not replacing NVIDIA Nsight or Visual Studio. We're the glue that connects them - run quick profiles inline, launch full Nsight GUI when you need deep analysis, all without losing your context.
Learning CUDA: Start with VS Code. Free, lightweight, good docs. Focus on making kernels work before optimizing.
Windows production: Visual Studio for debugging crashes. RightNow AI runs NVIDIA Nsight automatically for quick iterations, one-click to full GUI when needed. This covers the full cycle.
Cross-platform libraries: CLion for consistent editing. RightNow AI for multi-GPU testing without $4,500/month cloud bills.
Cloud GPUs: VS Code for remote editing. RightNow AI for remote profiling that feels local.
Research with GPU queues: RightNow AI's emulator means you develop on laptops, test on virtual hardware, submit jobs only when you know they'll work. Teams report 3x faster iteration.
Privacy-sensitive work: RightNow AI with local LLM. No external API calls. Full AI assistance without code leaving your infrastructure.
Modular approach (traditional tools):
Unified approach (RightNow AI):
Most productive setup: RightNow AI orchestrates everything - profiling terminal for quick iterations with AI bottleneck detection, benchmarking across configs, multi-GPU testing, remote connections, one-click launch to full NVIDIA Nsight when you need comprehensive analysis.
Free tier: unlimited profiling/benchmarking, emulator access, remote GPU support, limited AI credits. Windows & Linux (x64 & ARM64).
Pro tier: multi-GPU profiling, unlimited AI analysis, priority support.